

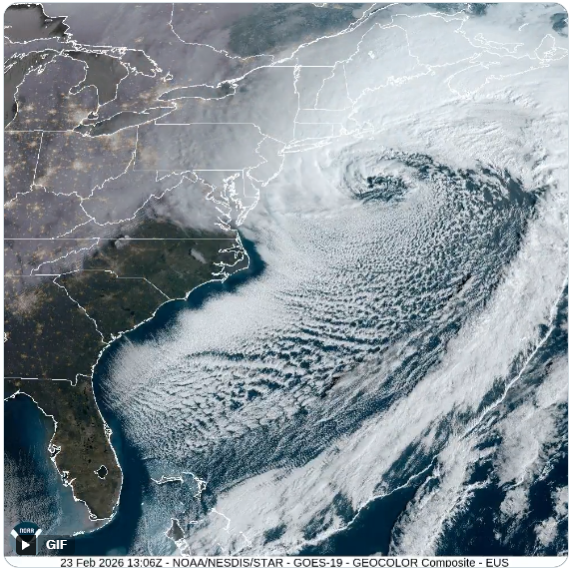
Blizzard of 2026: Synoptic Analysis
Initially, it appeared that the storm that would later become known as “The Blizzard of 2026” would pass far enough to the south & east of New England to spare the region a major hit. This appeared to be the case as late as Thursday night/predawn Friday (February 19-20). However, successive model runs into that weekend trended the storm track closer and closer to land. By Saturday, February 21 it became apparent that a rapidly developing coastal storm was getting ready to bring blizzard conditions to portions of the region.
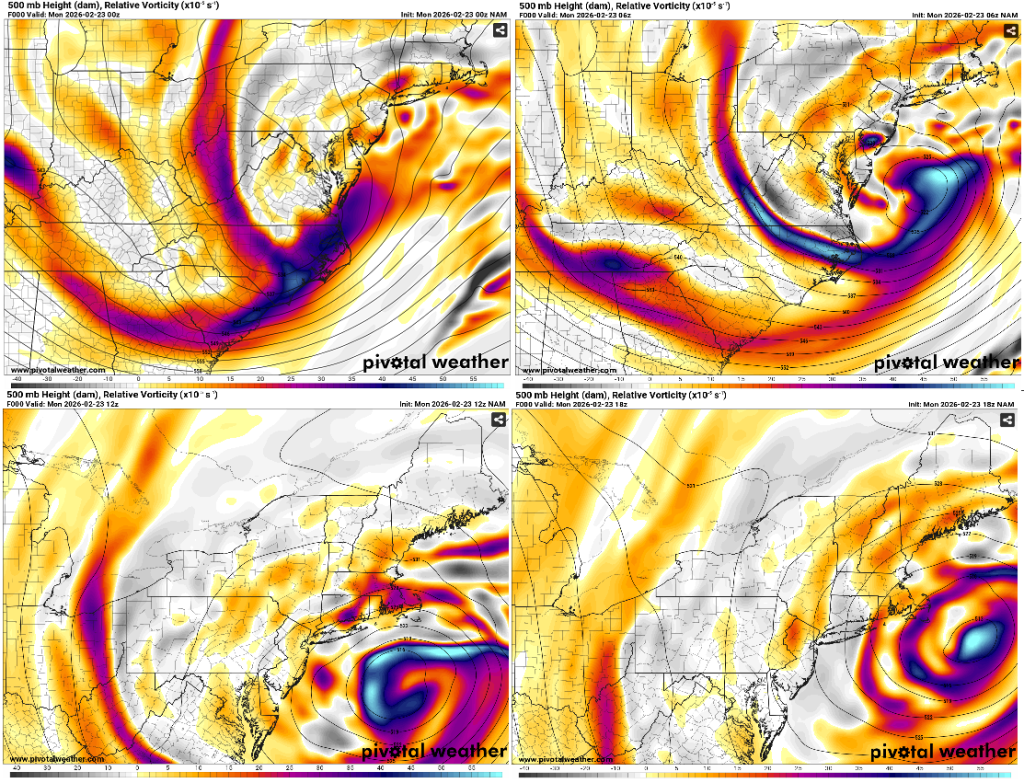
Conditions Aloft As The Storm Intensified
A potent 500 millibar, shortwave trough transitioned into a closed low pressure system as it moved off the mid-Atlantic coast, east of the Delmarva Peninsula Sunday night/predawn Monday morning, February 22-23, 2026.
Meanwhile, significant upper-level height falls, in excess of 300 meters, resulted in bombogenesis (explosive cyclogenesis). Bombogenesis (a bomb cyclone) is a rapidly intensifying storm that experiences a pressure drop of at least 24 millibars within 24 hours at 60 degrees north latitude. At 40 degrees north latitude the required pressure drop is 17.8 millibars within 24 hours.
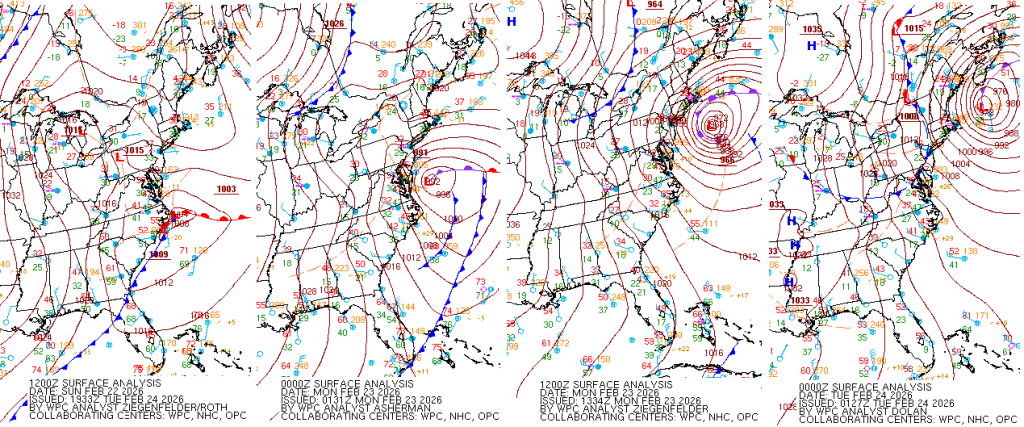
Blizzard of 2026 Surface Analysis
During February 22-23 the central pressure in the storm that is now colloquially known as “The Blizzard of 2026″ experienced a pressure drop of 41 millibars in 24 hours! Therefore, this resulted in heavy snow and strong winds across the northeast corridor.
The central pressure of the storm bottomed out at 965 millibars (28.50″) on February 23. This is typical of the atmospheric pressure that you would see in the center of a category 2 hurricane!
As the center of the surface low tracked a bit south & east of the benchmark (40 degrees N latitude, 70 degrees W longitude, in the Atlantic Ocean) the heaviest precipitation and strongest winds occurred along the coast. Further inland, across northern Connecticut and western Massachusetts, it was not as memorable of a storm. Snowfall was lighter and winds a bit lower. However, Bradley International Airport, in Windsor Locks, Connecticut (11.8″ of snow) measured a wind gust to 54 miles per hour Monday morning (February 23). Moreover, Brainard Airport, in Hartford, gusted to 51 mph.
Storm Impacts
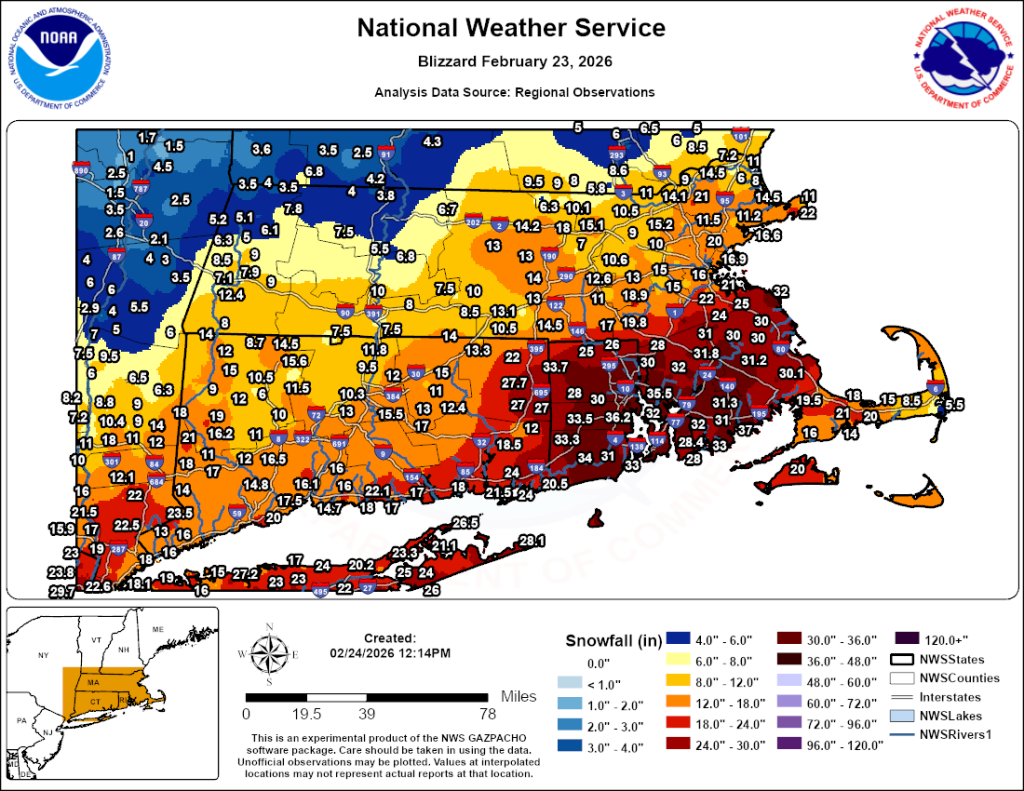
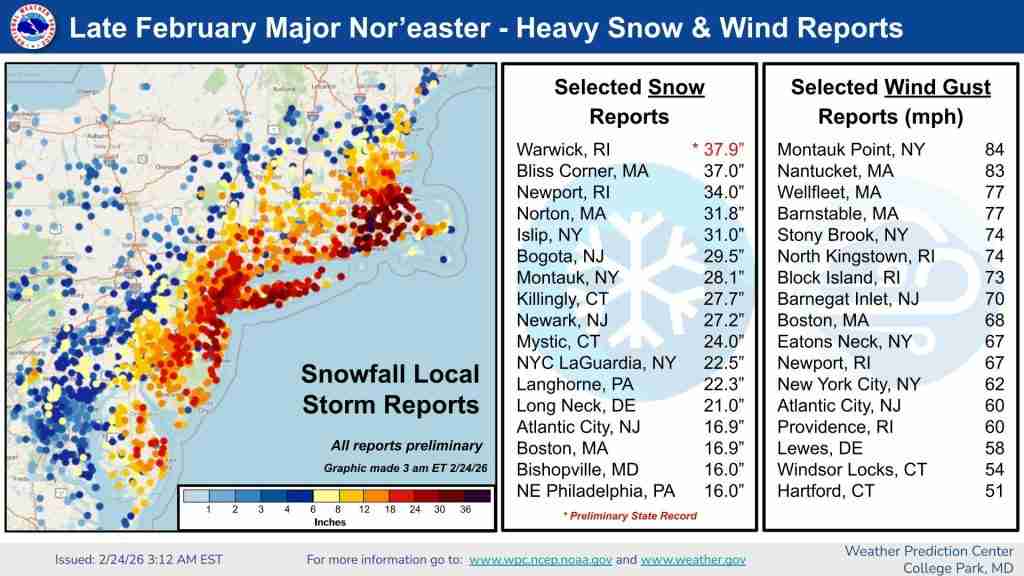
The Blizzard of 2026 was a historic storm that produced more than 24″ of snow in 5 different states and wind gusts of 84 mph at Montauk Point, NY (eastern tip of Long Island) and 83 miles per hour on Nantucket. Moreover, a State of Emergency was declared in Connecticut, Delaware, Massachusetts, New Jersey, New York, Pennsylvania, and Rhode Island.
The epicenter of this historic blizzard was Providence, Rhode Island (T.F. Green International Airport is actually located in nearby Warwick, RI), which received 37.9″ of snow and reported a wind gust to 68 mph! This broke the previous single storm snowfall record, which up until then had been set during the Blizzard of 1978, when 28.6″ of snow fell. The entire 37.9″ fell in less than 24 hours! KPVD also set a new calendar day record, with 35.5″ of the storm total accumulating during Monday, February 23.
In addition, New York City (Central Park) received 19.7″ of snow, making it the 9th largest snowfall on record there. Central Park records date back to 1869. Although, technically, blizzard conditions were not reached in the city, the blizzard warning that was issued for NYC was the first one in 9 years. Boston (Logan International Airport), which did see blizzard conditions, reported 16.9″ of snow.
Locations That Experienced Blizzard Conditions
Note: Blizzard conditions are defined as at least 3 consecutive hours with wind sustained at, or frequently gusting to at least 35 miles per hour, with visibility of less than 1/4 mile due to falling and/or blowing snow.
At the height of the Blizzard of 2026, over 600,000 people lost power. In addition, snowfall rates increased up to 1″-3″ per hour. Meanwhile, there were reports of thundersnow in southeastern New England, including New Bedford, MA and in lower Manhattan. Blizzard warnings were issued in Delaware, eastern Maryland, the entire state of New Jersey, all of Connecticut and Rhode Island, and eastern Massachusetts. Blizzard conditions were verified by the National Weather Service in New Jersey, Long Island, coastal Connecticut, Rhode Island, and southeastern Massachusetts. This included, in Massachusetts: Bedford, Boston, Beverly, Chatham, Falmouth, Hyannis, Martha’s Vineyard, New Bedford, Norwood, and Worcester. In Rhode Island: Block Island, Providence, Smithfield, Newport, and Westerly. And in Connecticut: Bridgeport, Groton, and New Haven. Islip, Long Island had blizzard conditions and received a record setting 31″ of snow. Blizzard conditions also occurred in Hampton and Rochester, New Hampshire.
During February 22-24 roughly 11,000 airline flights were canceled, due to the storm, with tens of thousands more delayed. Amtrak canceled more than 30 trains.
Travel Bans
New York City issued a travel ban for all non-essential vehicles on all street, bridges, highways, and tunnels from approximately 9:00 P.M. Sunday, February 22 through noon on Monday, the 23rd. A mandatory, statewide travel restriction (Turnpike exempt) ran from 9:00 P.M. Sunday through 2:00 P.M. Monday in New Jersey.
Meanwhile, Massachusetts issued a ban on non-essential vehicles in Bristol and Plymouth Counties, Cape Cod, and Martha’s Vineyard Monday afternoon, until about noon on Tuesday, February 24. A statewide travel ban was issued for all of Rhode Island and lifted at noon on Tuesday.
In addition, Delaware prohibited travel by non-exempt vehicles in Kent and Sussex Counties at 9:00 P.M. Sunday that continued into Monday. Connecticut prohibited commercial vehicles from travel on limited-access highways (interstates) from 5:00 P.M. Sunday until 4:00 P.M. Monday. New York State banned empty commercial vehicles and tandem tractor-trailers from some highways, including Thruway roads in Orange, Rockland, and Westchester Counties.
Blizzard of 2026 Snowfall Amounts and Peak Wind Gusts
Below is a list of snowfall amounts taken from the Weather Prediction Center‘s website. The first group of snowfall reports (above the peak wind gust reports) might not all be final totals. This is because the storm was still finishing up when the WPC’s final storm summary was issued. The snowfall totals that follow the peak wind gust reports are final snowfall totals.
| ***SNOWFALL AMOUNTS*** | |||||||
| …CONNECTICUT… | |||||||
| KILLINGLY 1 SW | 27.7 | ||||||
| MYSTIC 4 ESE | 24 | ||||||
| CHESTER | 22 | ||||||
| BRIDGEPORT AIRPORT | 20 | ||||||
| LEDYARD CENTER 2 E | 20 | 1 | |||||
| NORWICH | 19.8 | ||||||
| CANTERBURY | 18 | ||||||
| NEW HAVEN | 16.1 | ||||||
| PUTNAM 1 W | 15 | ||||||
| BERLIN 2 E | 13 | ||||||
| BRADLEY APT | 11.8 | ||||||
| …MAINE… | |||||||
| GOODWINS MILLS 2 NE | 13 | ||||||
| TRESCOTT | 12 | ||||||
| MILFORD 1 ESE | 7.5 | ||||||
| SOUTH PORTLAND 2 SW | 6.5 | ||||||
| N KEENE 3.3 | 5.3 | ||||||
| …MASSACHUSETTS… | |||||||
| BLISS CORNER 2 NNE | 37 | ||||||
| NORTON/NWS BOSTON | 31.8 | ||||||
| BERKLEY 1 NE | 31 | ||||||
| SOMERSET 1 NNE | 31 | ||||||
| DIGHTON | 29 | ||||||
| SWANSEA | 26 | ||||||
| FOXBOROUGH 1 NE | 24.5 | ||||||
| HOLLISTON | 18.9 | ||||||
| BOSTON LOGAN ARPT | 16.9 | ||||||
| …NEW HAMPSHIRE… | |||||||
| DOVER | 9.5 | ||||||
| STRATHAM 2 ENE | 9 | ||||||
| …RHODE ISLAND… | |||||||
| TF GREEN AP | 37.9 | Preliminary State Record | |||||
| WARWICK 1 SE | 36.2 | ||||||
| NORTH KINGSTOWN | 35 | ||||||
| NEWPORT APT 1 SW | 34 | ||||||
| PROVIDENCE 2 E | 33.5 | ||||||
| COVENTRY | 33 | ||||||
| NARRAGANSETT 2 WNW | 33 | ||||||
| ***PEAK WIND GUSTS*** | |||||||
| …CONNECTICUT… | |||||||
| BRADLEY ARPT | 54 | ||||||
| HARTFORD-BRAINARD ARPT | 51 | ||||||
| …DELAWARE… | |||||||
| LEWES | 58 | ||||||
| SR1 IRIB NORTH | 51 | ||||||
| …MAINE… | |||||||
| FRENCHBORO 15 ESE | 70 | ||||||
| EAST SURRY | 53 | ||||||
| …MARYLAND… | |||||||
| OCEAN CITY INLET | 51 | ||||||
| COVE POINT LNG PIER | 45 | ||||||
| …MASSACHUSETTS… | |||||||
| NANTUCKET | 83 | ||||||
| BARNSTABLE | 77 | ||||||
| WELLFLEET | 77 | ||||||
| GOSNOLD 5 WSW | 74 | ||||||
| NORWELL 2 WSW | 73 | ||||||
| SANDWICH 2 NNE | 73 | ||||||
| CHATHAM AP | 72 | ||||||
| MARTHAS VINEYARD AP | 71 | ||||||
| ORLEANS 2 N | 71 | ||||||
| JAMESTOWN 3 WNW | 70 | ||||||
| BOSTON LOGAN INTL ARPT | 68 | ||||||
| WOODS HOLE 1 WSW | 66 | ||||||
| …NEW JERSEY… | |||||||
| BARNEGAT LIGHT | 70 | ||||||
| ATLANTIC CITY | 61 | ||||||
| NEWARK | 54 | ||||||
| …NEW YORK… | |||||||
| MONTAUK POINT | 84 | ||||||
| STONY BROOK | 74 | ||||||
| PECONIC | 69 | ||||||
| EATONS NECK | 67 | ||||||
| NEW YORK/JFK | 62 | ||||||
| NEW YORK/LGA | 52 | ||||||
| ISLIP | 47 | ||||||
| CENTRAL PARK | 43 | ||||||
| …NORTH CAROLINA… | |||||||
| WAGONER 2 NW | 58 | ||||||
| DUCK PIER | 53 | ||||||
| …RHODE ISLAND… | |||||||
| NORTH KINGSTOWN 2 NE | 74 | ||||||
| BLOCK ISLAND 2 N | 73 | ||||||
| JAMESTOWN 3 WNW | 70 | ||||||
| TF GREEN ARPT | 68 | ||||||
| …SOUTH CAROLINA… | |||||||
| CHARLESTON 2 ESE | 53 | ||||||
| BEAUFORT 3 NW | 51 | ||||||
| MARINE CORPS AIR STATION | 51 | ||||||
| …VIRGINIA… | |||||||
| YORK SPIT | 54 | ||||||
| RAPPAHANNOCK LIGHT | 53 | ||||||
| ***SNOWFALL AMOUNTS*** | |||||||
| …DELAWARE… | |||||||
| LONG NECK 2 SW | 21 | ||||||
| WOODSIDE | 20.5 | ||||||
| BETHEL | 19.3 | ||||||
| DELAWARE COASTAL APT | 19 | ||||||
| SEAFORD 0.6 WSW | 19 | ||||||
| SELBYVILLE | 18.5 | ||||||
| MILLSBORO 5.6 ENE | 17.5 | ||||||
| DOVER | 16.5 | ||||||
| HARRINGTON | 16.1 | ||||||
| HOCKESSIN | 10 | ||||||
| …WASHINGTON DC… | |||||||
| CATHOLIC UNIVERSITY | 3.6 | ||||||
| …MARYLAND… | |||||||
| BISHOPVILLE | 16 | ||||||
| PITTSVILLE 2 NE | 14 | ||||||
| BERLIN 3.9 SE | 10.5 | ||||||
| OCEAN CITY | 10.5 | ||||||
| DELMAR 0.3 ESE | 10.3 | ||||||
| CAVETOWN 3 ESE | 10 | ||||||
| PARSONSBURG | 9 | ||||||
| SALISBURY | 9 | ||||||
| ELKTON 2 W | 8.5 | ||||||
| WATERSVILLE 1 N | 6.8 | ||||||
| …NEW JERSEY… | |||||||
| BOGOTA | 29.5 | ||||||
| NEWARK AIRPORT | 27.1 | ||||||
| FREEHOLD | 26 | ||||||
| CRANBURY | 21 | ||||||
| MORRISVILLE 2 SSW | 21 | ||||||
| RIDGEFIELD | 20.6 | ||||||
| MOUNT HOLLY WFO | 20.3 | ||||||
| CHATHAM 1 NW | 20 | ||||||
| LAKE PINE | 19.2 | ||||||
| CRANFORD | 18.6 | ||||||
| NORTH BRUNSWICK | 18.5 | ||||||
| MAMARONECK 2 N | 18 | ||||||
| MANCHESTER TWP 5.6 NE | 18 | ||||||
| SOMERDALE | 18 | ||||||
| ATLANTIC CITY | 16.9 | ||||||
| HOBOKEN 1 WSW | 16.5 | ||||||
| …NEW YORK… | |||||||
| CENTRAL ISLIP | 31 | ||||||
| MONTAUK | 28.1 | ||||||
| REMSENBURG-SPEONK | 27.5 | ||||||
| NORTH PATCHOGUE | 27.2 | ||||||
| SHIRLEY AIRPORT | 26 | ||||||
| FORT SALONGA 1.5 SSE | 25.2 | ||||||
| HARTSDALE 1 SE | 24 | ||||||
| QUOGUE 1 SSE | 23.5 | ||||||
| NYC/LA GUARDIA | 22.5 | ||||||
| WASHINGTON HEIGHTS | 22 | ||||||
| PLAINVIEW | 21.5 | ||||||
| EAST MEADOW 1 ENE | 20.8 | ||||||
| NYC/JFK | 20.1 | ||||||
| CENTRAL PARK | 19.7 | ||||||
| CROWN HEIGHTS | 18 | ||||||
| MAMARONECK 2 N | 18 | ||||||
| …PENNSYLVANIA… | |||||||
| LANGHORNE 1NNW | 22.3 | ||||||
| MORRISVILLE 2 SSW | 21 | ||||||
| BENSALEM | 17 | ||||||
| PHILADELPHIA INTL | 14 | ||||||
| MORTON | 13.4 | ||||||
| WILLOW GROVE | 13.2 | ||||||
| SABILLASVILLE 2 NNW | 12.3 | ||||||
| …VIRGINIA… | |||||||
| WHITETOP | 14 | ||||||
| WALLOPS ISLAND 3 N | 11.2 | ||||||
| GLEN BURKE | 10 | ||||||
| ARLINGTON 3 WNW | 4 | ||||||
| …WEST VIRGINIA… | |||||||
| POINT MOUNTAIN | 22.5 | ||||||
| CRAIGSVILLE 8 SSW | 21 | ||||||
| RED CREEK 4 NE | 16 | ||||||
| HARMAN 7 W | 13.5 | ||||||
| TERRA ALTA | 8 | ||||||
| CIRCLEVILLE 6 SW | 6 | ||||||
| SENECA ROCKS 6 NW | 6 |